Disclaimer
Flood hazard and flood risk maps provided on this website are generated using the CaMa-Flood model (1). These maps are intended for use at national, provincial, or regional scales and can serve as a guide for identifying areas that require further investigation. Flood Hazard maps for current and future (climate change-affected) conditions, as well as Flood Risk maps, are available at a 1 km resolution. Due to uncertainties in the modeling process and variability in results, these maps serve as a starting point for identifying opportunities to enhance solutions through further exploration.
For additional details on the methods, tests, models, and datasets used to generate these data layers, please review the Learn More section of the website.
(1) Mohanty, M. and S. P. Simonovic (2020). A comprehensive framework for regional floodplain mapping. Water Resources Research Report No. 109, Facility for Intelligent Decision Support, Department of Civil and Environmental Engineering, The University of Western Ontario, London, Ontario, Canada, 58 pages. ISBN: (online) 978-0-7714-3148-7, open access: https://www.eng.uwo.ca/research/iclr/fids/publications/products/109.pdf.
User guide
This guide explains how to use the Flood Risk Canada.
Prerequisites
To access the Flood Risk Canada, you should use the latest version of one of the following browsers:
Optionally, if you want to open the downloaded files (full or clipped), a Geographic Information System (GIS) processing software should be used. The recommended software is the free, open-source Quantum GIS (QGIS):
Landing page
The landing page will show the main options of the Flood Risk Canada:
- Flood Hazard Maps: Visualization of interactive maps showcasing areas prone to flooding and complementary maps
- Flood Risk Assessment: Analysis of flood risks with address search, including potential impacts and mitigation strategies
- Learn More: Methodology used to produce the flood maps
- Download: Download page for the maps and other files
- User Guide: This document

Exporting, clipping and downloading
These functionalities enable you to export visible areas of the map, define a clipping area, and download both full and clipped versions of the maps.
Exporting and downloading
The following buttons allow the export (create a screenshot of the visible map area and all visible layers, and access the download page, respectively).

Clipping
The clipping functionality allows you to select a region of interest to zoom in and download reduced (clipped) map layers. The buttons located on the top right are:
- Rectangle button: create the clipping region
- Edit button: edit, change and move the selected clipping area
- Delete button: remove the selected clipping area
The list of buttons described is shown on the map page as follows

Once a clipping area has been selected, a region (rectangle) is displayed to indicate your selection.

When editing a clipping area, dashed lines are shown, and the corners and center point are highlighted.

The Delete button allows removing an existing clipping area by using the Clear all option or clicking on the selected area. Save will confirm the removal and Cancel will undo your action.

Downloading files
The download button will take you to a list of files available for download. The first option is a complete file of each layer (Full file) that is compressed with 7-Zip (.7z extension) and, if a clipping area was defined on the map, a Clipped file option will be available.

We recommend installing 7-Zip to decompress and open the Full files. 7-Zip is free open-source software. You can use 7-Zip on any computer, including computers in commercial organizations without registration or payment.
PART 1: Flood Hazard Maps
The initial page will show a map of Canada using Open Street Maps as the base layer, similar to the following figure.
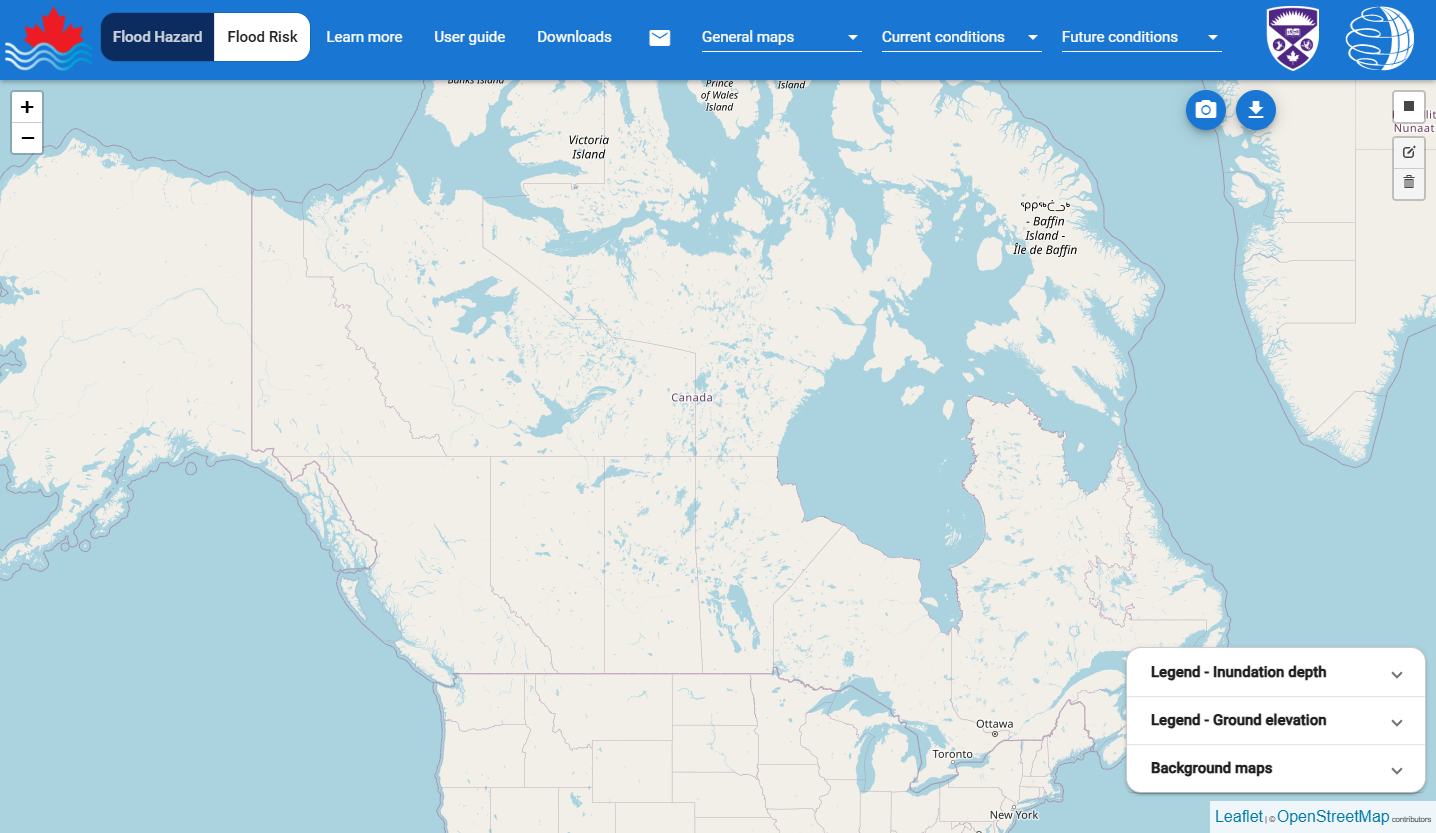
The main flood hazard page has the following controls that you can use:
1.1 Map options
When you open the Flood Hazard Maps menu item, three categories of overlaying maps are available:

Each of the overlay maps categories is briefly described as follows:
1.1.1 General maps
This option presents the following overlay maps that are available for selection and briefly described:
- Canada DEM: Digital Elevation Model (DEM) for Canada
- Canada High Res DEM: A higher resolution DEM for Canada
- Drainage Basins: Drainage Basins of Canada
- Postal Codes: Postal Codes of Canada
Multiple layers can be selected to be overlayed with the flood maps. To add a layer to the map, click and select the desired option, and to remove the layer from the map, click again to unselect the layer.
1.1.2 Current conditions
This option allows you to select one of the flood maps created based on current conditions. Only one flood map can be selected at a time. To remove the selected layer from the map, choose the None option from the list.
The available map options are the following:

Please review the Methodology section of the Learn More menu for a detailed explanation of map versions. Hovering over the map number shows a reference to the map type. When you select a map, for example, H25 (25 yr, 1980 – 2019 CMIP6 ensemble), the flood water depth information is presented on the screen as one layer.

The corresponding Legend menus explain the colour shades of the flood maps and DEMs. In addition to the visual information, the user can obtain detailed information by selecting a location on the map. The Info box (as shown below) provides geographic coordinates of the chosen location; surface elevation (if DEM layer is loaded); and flood map and water depth (if the flood map layer is loaded).

1.1.3 Future conditions flood maps
This option allows you to select one of the flood maps created based on future conditions (considering climate change). Only one flood map can be viewed at a time. To remove a flood map, select the None option from the menu.
The available map options are the following:

For information on the map version, please check the Methodology section under Learn more.
Hovering over the map number will also show a map type.
1.2 Base maps and transparency
There are two options of base maps to choose from:
OpenStreetMaps
OpenStreetMap is a map of the world, created by volunteers and free to use under an open licence. https://www.openstreetmap.org/.
Google Imagery
Google hybrid satellite and street static tiled layer.
The base map selection can be made from the Base layer box at the bottom-right corner. Your selection will be highlighted in blue, and the base maps will reflect the selection.
One additional functionality is provided by the transparency bar. It allows you to set the level of transparency for the overlaying maps (from 0: no transparency to 100: fully transparent).

1.3 Legends
The Legend helps to understand the colour shades for the two main layer types:
Inundation depth: each colour represents a flood depth from a light blue for lower levels to a darker shade of blue for higher levels.

DEM: the terrain elevation is represented by a colour-ramp version from orange (minimum value) to blue (maximum value) and green (in between).

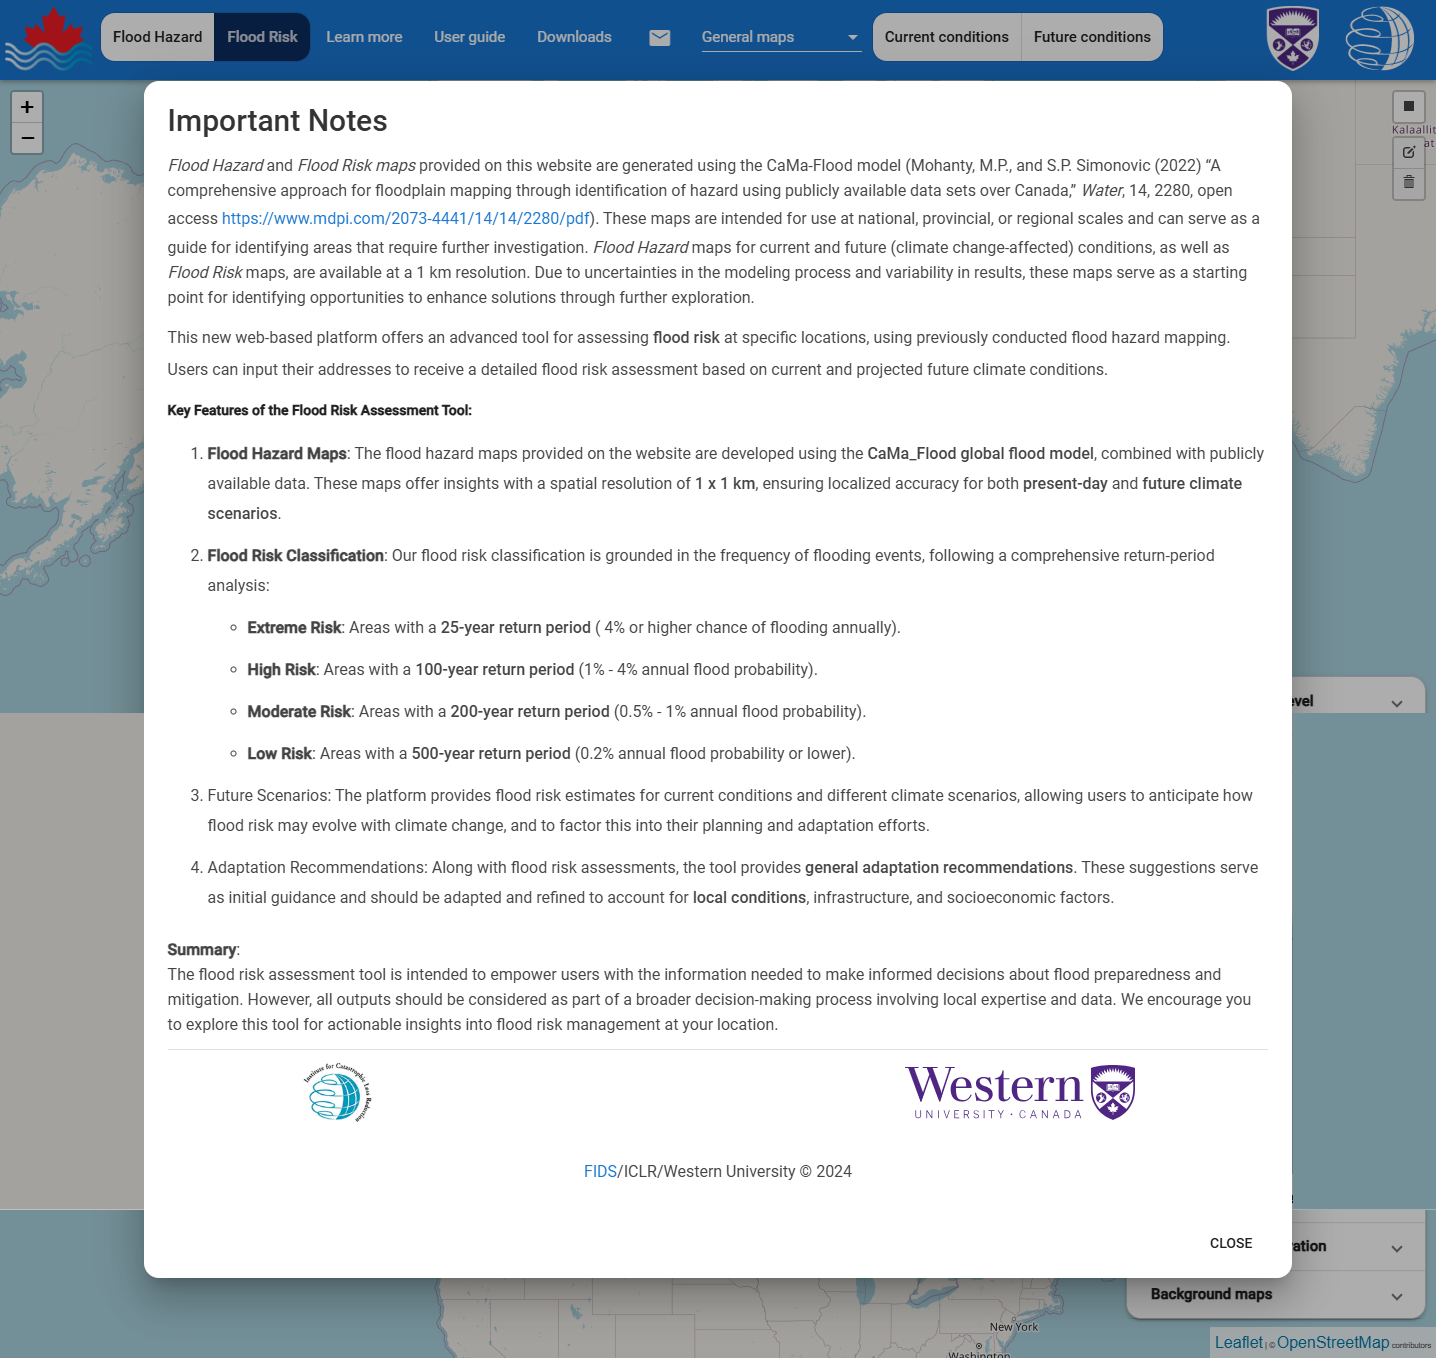
PART 2: Flood Risk Assessment
When accessing the Flood Risk Assessment page, an initial disclaimer will be presented to you, as shown in the following figure.
The Flood Risk Assessment module includes the following functions you can use:
2.1 Current and Future Conditions Risk Assessment
When you open the Flood Risk Assessment page, you will have access to the General Maps (as described above) and two categories of risk assessment: Current and Future conditions, as illustrated below.

Selecting the Current or Future conditions option activates the address search box, as shown in the following figure.
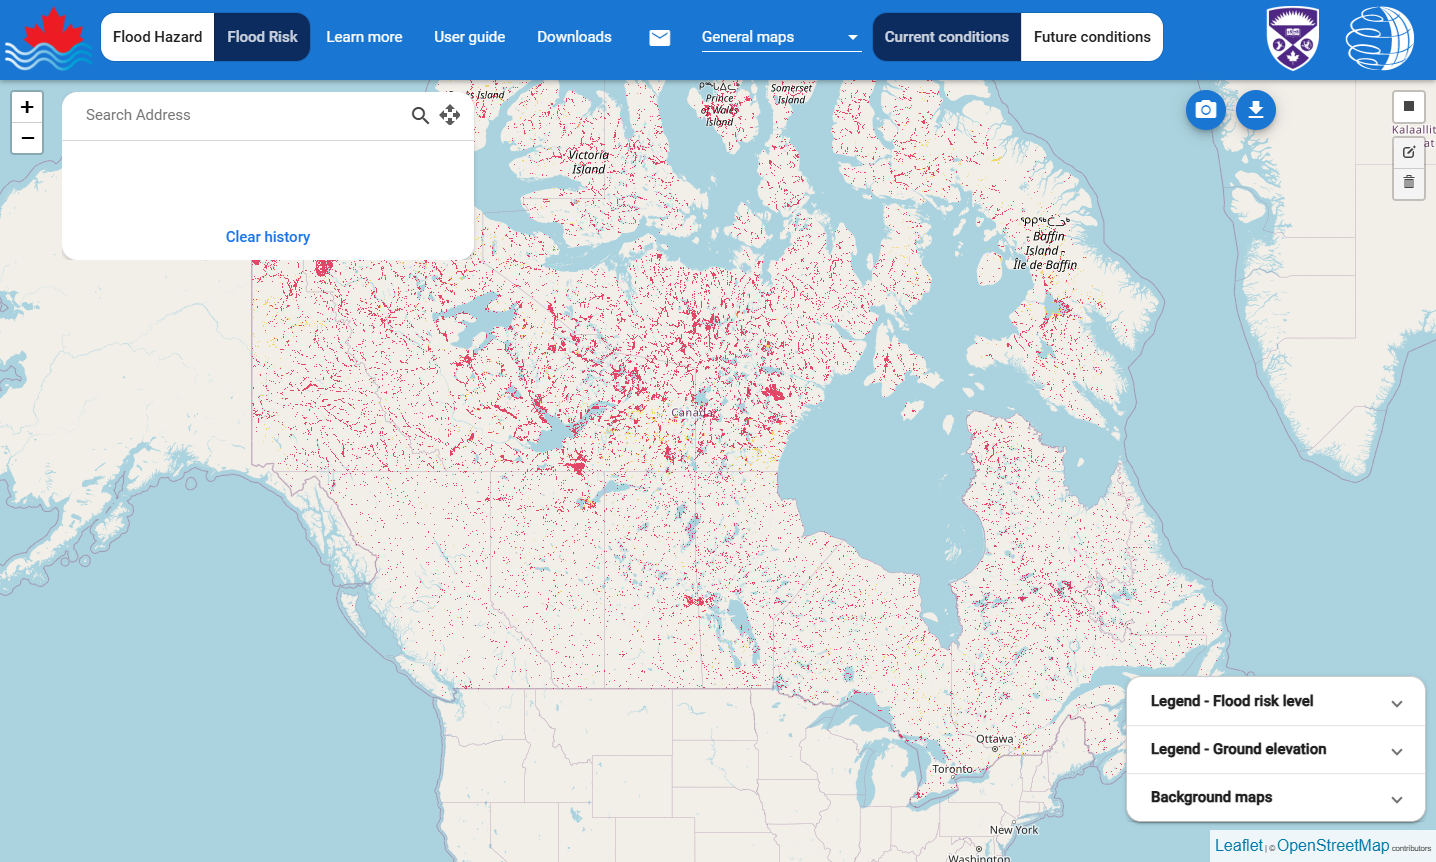
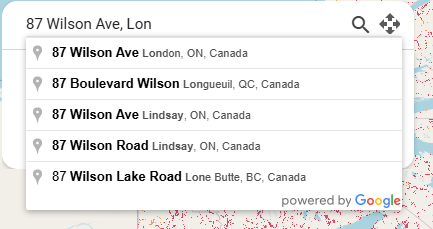
2.1.1 Address search
The address search functionality operates in a manner similar to widely used search engines. As you begin entering an address, a list of suggestions will be generated based on your input. Select the appropriate address from the list to retrieve the corresponding flood risk assessment.
The address search functionality is designed to provide accurate and efficient location-based results, leveraging the capabilities of the Google Maps Geocoding API. As you begin typing an address into the search box, the tool dynamically interacts with Google's API to generate a list of relevant suggestions in real-time. These suggestions are derived from a database of locations, ensuring that even partial or incomplete inputs are matched to the most likely addresses.
Once you select an address from the list, the system uses the Google Maps Geocoding API to transform the selected address into precise geographic coordinates (latitude and longitude). These coordinates serve as the foundation for retrieving the risk assessment for the address provided. This process ensures high accuracy and reliability, even for complex or ambiguous addresses. Please refer to the Learn More section for more details.
By integrating the Google Maps Geocoding API, this functionality benefits from advanced geocoding algorithms, which account for regional nuances, variations in address formatting, and the latest mapping updates.
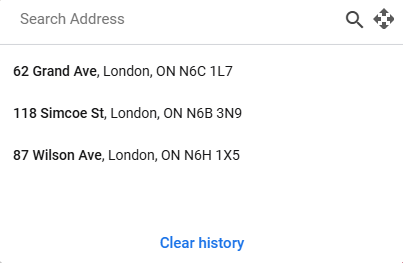
A record of your most recent searches will be maintained, allowing you to revisit them by selecting the desired address from the history list.
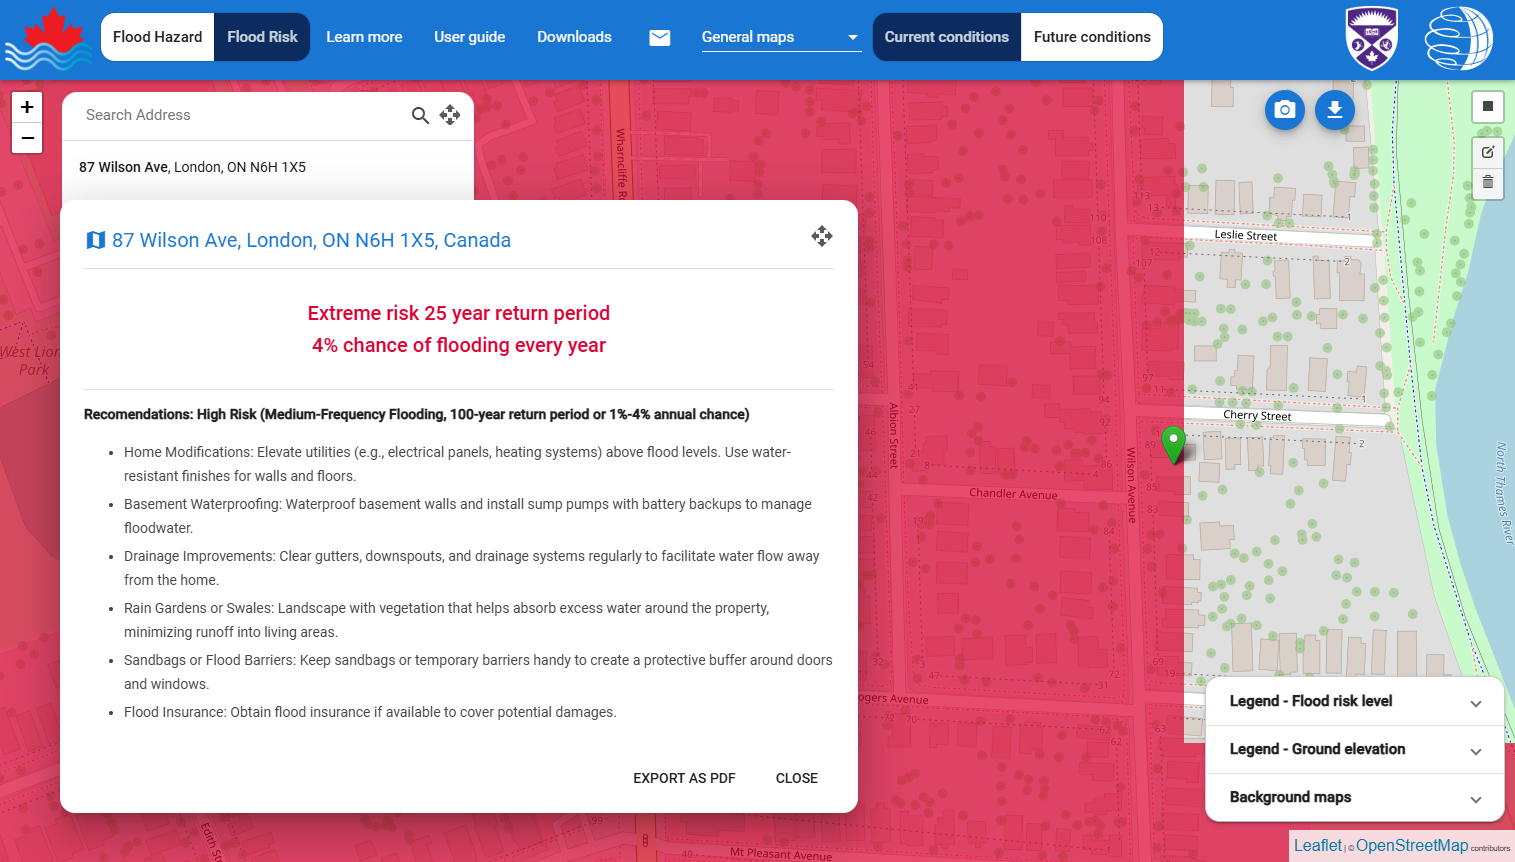
2.1.2 Risk assessment for Current conditions
When this option is selected, the flood risk maps for the current conditions will be loaded. Upon selecting an address, the risk assessment results will provide:
- The level of risk (see risk classification)
- Recommendations corresponding to the identified risk level
Refer to the image below for further clarification.
The next window displays the risk assessment and corresponding recommendations. The green pin on the map, indicates the location of the selected address. The title of the window includes the selected address along with a link to Google Maps. Additionally, the Export PDF button enables you to save the results to a file for future reference.
You can use the move icon (![]() ) to reposition the address search and risk assessment boxes freely on the screen.
) to reposition the address search and risk assessment boxes freely on the screen.
2.1.3 Risk assessment for Future Conditions
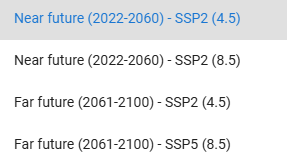
This option enables you to evaluate the flood risk under four projected future scenarios:
- Near future (2022-2060) - SSP2 (4.5)
- Near future (2022-2060) - SSP5 (8.5)
- Far future (2061-2100) - SSP2 (4.5)
- Far future (2061-2100) - SSP5 (8.5)
When Future Conditions is selected, the risk assessment box will present a list of four conditions within the output window, as shown below. Select the desired future scenario from the list to access the recommendations and load the associated risk map. For more details, visit the methodology section.
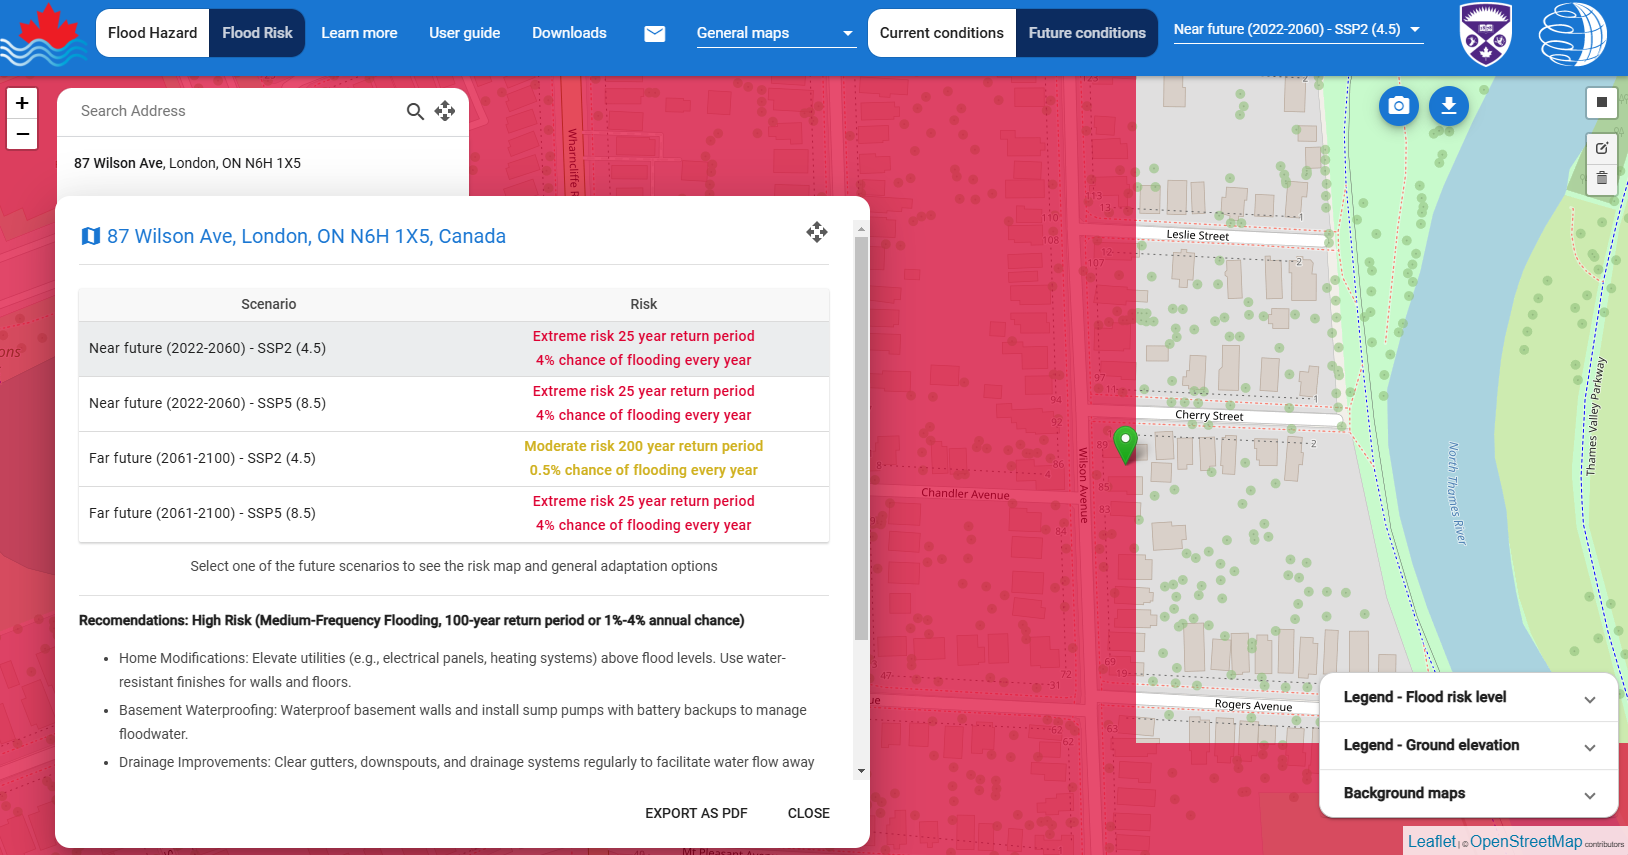
The flood risk map is presented in the top menu, positioned adjacent to the Future Conditions option, as illustrated below.